
Post #298
1000 words; 4 minutes to read
Summary: The 2025 report on crime in Canada is an instance of how data are misused when the focus is on only 1 or 2 aspects, especially to support positions already held. The data actually reveal a much more nuanced picture of crime.
The annual report on police reported crime in Canada is one of the best Canadian sources about crime. We have posted about earlier versions of this report a couple of times – 2020 and 2022. The newest report has data for 2025 as well as historical data for comparison.
This report shows the numbers and rate (per population) of many different kinds of crime over a period of years and also by province and city.
Looking at the data carefully leads to several conclusions.
Media reporting of these data tends to focus on what is sensational and does not result in a balanced picture. The focus is on those crimes that seem to be increasing, while those decreasing, or the long term trend are ignored. Politicians and other interest groups selected data to support their positions rather than developing positions based on data.
For example, a couple of years ago there was a lot of attention to car theft, while the significant decline in the last two years was ignored. Homicides are way down, a fact that gets very little coverage. Tough on crime advocates consistently refuse to acknowledge that crime in Canada overall is a lot lower than in past.
Another interesting example is hate crimes. Under 5000 of these were reported in 2025, similar to 2023 and 2024 – and a small number compared to, say, assault against a peace officer, with some 14,000 charges. (It seems most unlikely that there really are far more assaults against police than there are hate crimes, which could be a function of what police pay more attention to.)
Half of reported hate crimes are around ‘race’, with about 1/3 of those related to Black people. About a quarter are related to religion, with a big majority of those directed to Jews, 4 times as many as against Muslims even though there are many more Muslims in Canada who could potentially report them.
As a result of superficial or even biased analyses, the public gets a very distorted idea of crime in Canada.
How to look at data
How should one make use of these data, or really any crime data. to give a better picture of the actual situation?
The first thing is not to pay much attention to changes from one year to another, but to look at trends over longer time periods. Any statistic will show random variation from year to year, sometimes quite large variations. If the actual number is slow, as with homicides, a small variation in actual numbers can look like a big change in the rate, when actually it’s just a blip. We can only know that over multiple years of data.
Here the picture is clear about crime. Despite what many Canadians think, or infer from the media, this report shows that overall crime in Canada is low by historical standards. In 2025, the crime severity index was 37% lower than the peak in 1998 and 25% lower than the 2006 base year.
Canada is a big country, so it’s important to take regional variation into account. Crime rates and types vary a lot from one place to another. They have consistently been much higher in the Territories than the Prairie provinces – from 3 to even 8 times as high – as in other parts of the country. And specific types of crime can also vary a lot from place to place. And in smaller communities, small variations in numbers, as above, will show as large variations in percentages.
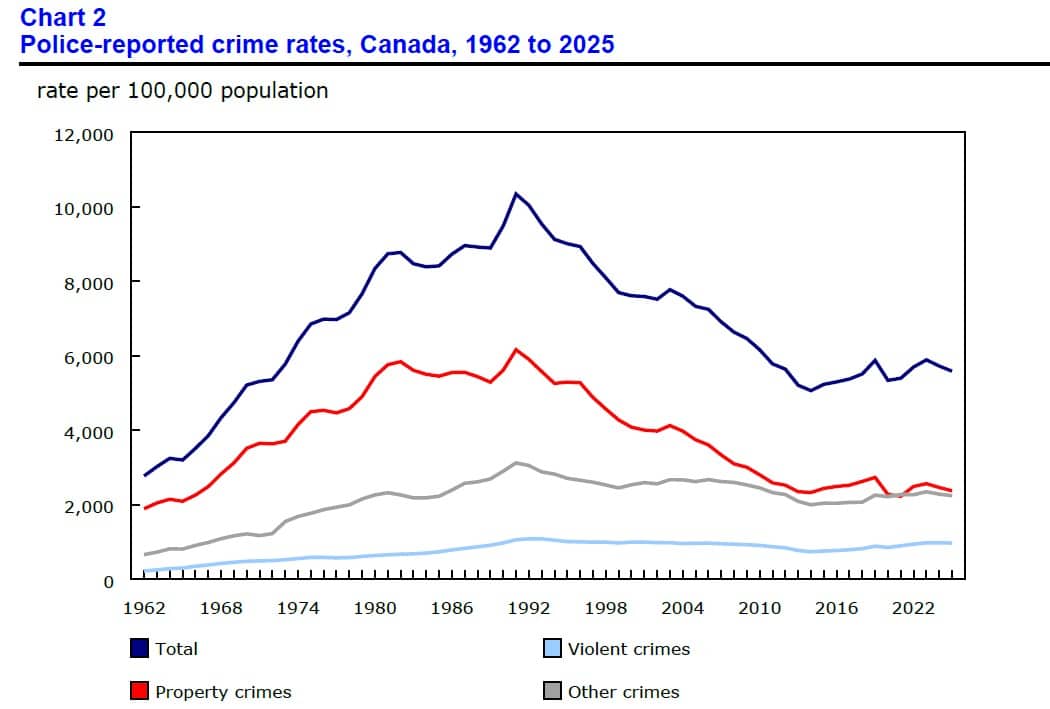
The way that crimes are put into categories also matters. Our attention tends to focus on a few of the most sensational crimes such as murder or child exploitation, but the vast bulk of reported crime falls into less exciting categories. In 2025 there were more than 2.3 million reported crimes in Canada, of which about 600,000 were classified as ‘violent’. But of the violent crimes, more than 200,000 were level 1 assault, which typically does not involve any injury, and another 100,000 were ‘uttering threats’, which again does not involve actual violence. Compare that to about 670 homicides and about 690 attempted murders and one can see that most ‘violent crime’ is not very violent. It’s still a problem, but not the kind that comes to mind when we hear ‘violent crime’. The category as constructed may mislead us.
Some crimes also get more police attention at certain points, which can greatly affect the both the rate and the trend. When a particular crime get more public attention, the police also tend to pay more attention to it, leading to more charges in that category. (Which also means that other crimes may get less attention from police.) We can see many examples of this in the historical data, such as child abuse in the 1980s and 1990s, or online exploitation more recently. When compulsory charging came in for domestic violence, the number of charges rose though the amount of domestic violence likely did not change much. In recent years human trafficking charges have increased while prostitution charges decreased. The reported umbers and trend lines may not be an accurate picture of the real situation.
The value and limits of statistics
Statistics do not tell us the whole picture, any more than a map tells us everything about a place. People can and do misuse data, sometimes deliberately for their own purposes, other times simply out of lack of understanding of how to understand numbers. But having data is almost always better than not having it, and paying careful attention to it is almost always better than picking and choosing a few bits. We can learn a lot if we let ourselves pay attention and try to suppress our starting beliefs.
About this blog: The John Howard Canada blog is intended to support greater public understanding of criminal justice issues. Blog content does not necessarily represent the views of John Howard Canada. All blog material may be reproduced freely for any non-profit purpose as long as the source is acknowledged. We welcome comments (moderated).
Winner of 2025 Clawbies award for law blogs.
Back
Comments are closed here.